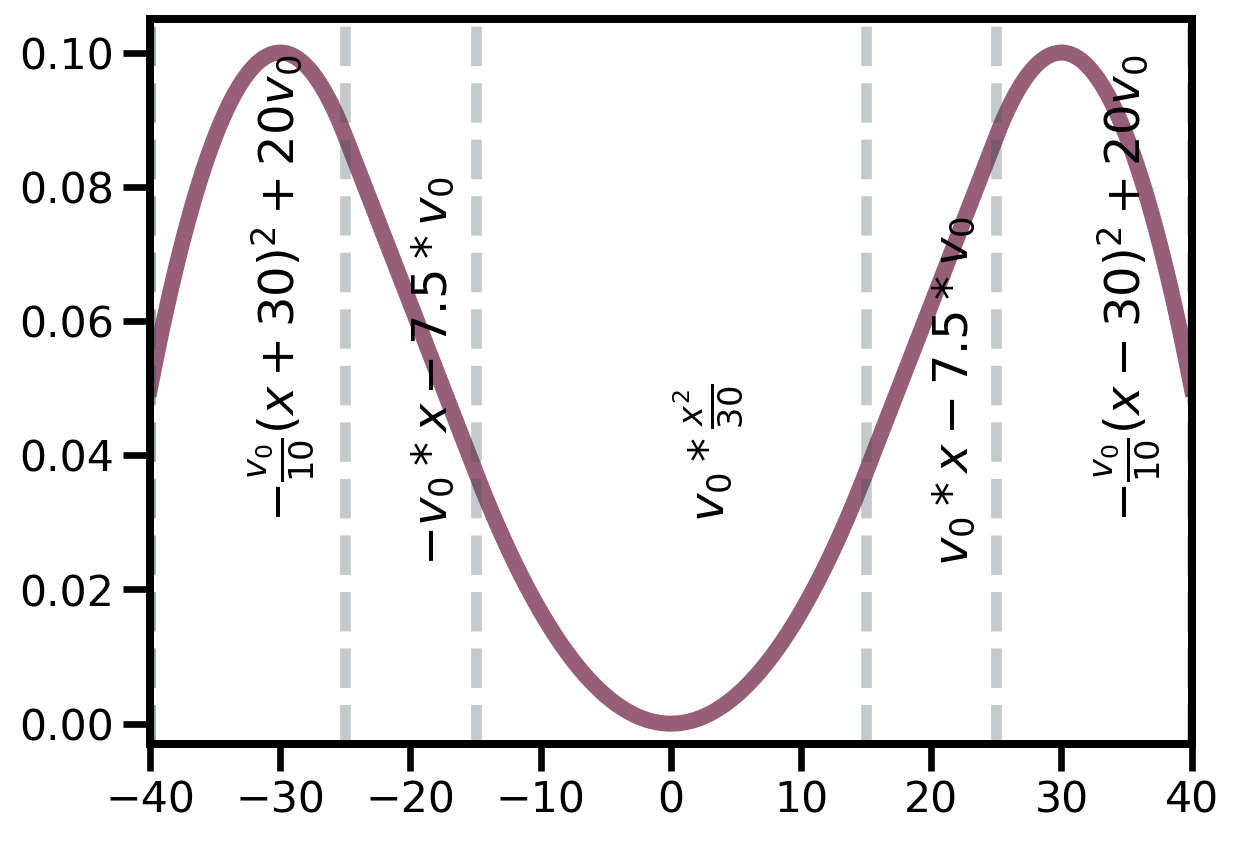
import numpy as npimport matplotlib.pyplot as plt= 70 = 0.005 = np.linspace(- 40 , 40 , 2000 )= []= '#3C4C4C' if iext == 70 :for x in X:if (x < - 25.0 ):- v0 / 10.0 * (x + 30.0 )** 2 + 20 * v0)elif (x < - 15.0 ):- v0 * x - 7.5 * v0)elif (x < 15.0 ):* x** 2 / 30.0 )elif (x < 25.0 ):* x - 7.5 * v0)else :- v0 / 10.0 * (x - 30.0 )** 2 + 20 * v0)= plt.subplots()= '#965F77' , linewidth= 6 )- .003 , 1.05 * max ((- v0 / 10.0 * (X + 30.0 )** 2 + 20 * v0))])= max ((- v0 / 10.0 * (X + 30.0 )** 2 + 20 * v0))# -40 -> -25 range = min (X) - (min (X) + 25 ) / 2 = min (X), linestyle= 'dashed' ,= graphite, linewidth= 4 , alpha= 0.3 )= x1, y= ymax/ 3 ,= r'$-\frac {v_0}{10} \left(x + 30\right)^2 + 20 v_0$' , rotation= 90 , size= 18 )# -25 -> -15 range = (- 25 - 15 ) / 2 =- 25 , linestyle= 'dashed' ,= graphite, linewidth= 4 , alpha= 0.3 )= x2, y= ymax/ 4 , s= r'$-v_0 * x - 7.5 * v_0$' , rotation= 90 , size= 18 )# -15 -> +15 range = 0 =- 15 , linestyle= 'dashed' ,= graphite, linewidth= 4 , alpha= 0.3 )= x3, y= ymax/ 3 , s= r'$v_0 * \frac{x^2} {30} $' , rotation= 90 , size= 18 )= 15 , linestyle= 'dashed' ,= graphite, linewidth= 4 , alpha= 0.3 )# 15 -> 25 range = (25 + 15 ) / 2 = 25 , linestyle= 'dashed' ,= graphite, linewidth= 4 , alpha= 0.3 )= x4, y= ymax/ 4 , s= r'$v_0 * x - 7.5 * v_0$' , rotation= 90 , size= 18 )# 25 -> 40 range = max (X) - (max (X) - 25 ) / 2 = min (X), linestyle= 'dashed' ,= graphite, linewidth= 4 , alpha= 0.3 )= x5, y= ymax/ 3 ,= r'$-\frac {v_0}{10} \left(x - 30\right)^2 + 20 v_0$' , rotation= 90 , size= 18 )= max (X), linestyle= 'dashed' ,= graphite, linewidth= 4 , alpha= 0.3 )for axis in ['top' , 'bottom' , 'left' , 'right' ]:3 )= 10 , width= 2.5 )- 40 ,40 )for label in (ax.get_xticklabels() + ax.get_yticklabels()):16 )